————
Thank you for your interest in DemandCaster.
The Excel template referenced in this blog is no longer available but click here to learn how the DemandCaster software system can be used to support your S&OP process. And to learn more about S&OP, refer to these articles What is S&OP? and Implementing Sales and Operations Planning.
Contact Us if you would like to speak to a DemandCaster representative.
————
Here at DemandCaster we are excited to announce our new blog series focused on different Microsoft Excel templates. The new blog series is inspired by the launch of our new custom reporting feature in our DemandCaster software. Below you will find a short introduction of the Custom reporting feature followed by our first Microsoft Excel template download. On behalf of the DemandCaster team we hope you enjoy.
Introducing DemandCaster’s New Custom Report Capability
When it comes to the reporting side of Sales and Operations Planning (S&OP), many of us struggle with presenting just the right amount of information in a chart without making it overly complex and hard to understand. There are many useful dashboards and reports that are important for companies in the S&OP process, however, some may not be useful for every company.
But first, a little history.
Over the last number of years, we have tried to understand how best to help our users address the multitude of reporting needs they have. At first, we wanted to pursue the route of services such as Tableau which provide impressive data visualization options. Upon evaluation, it became clear that services such as those provided by Tableau are a category in and of themselves and it did not make sense to replicate what others provide as their core capabilities. After talking too many of our users, we realized the best solution is to leverage a tool they already use every day – Microsoft Excel! Excel is remarkably powerful and ubiquitous tool that nearly everyone has sitting on their desktop. With this realization, we have spent nearly a year developing what we call Custom Reporting built into the DemandCaster platform.
DemandCaster Custom Reporting is a report engine that leverages Excel. It allows users to pull all the data that exists in DemandCaster and use that data to create custom reports and dashboards using user-designed templates that can produce an array of outputs, from graphs to pivot tables and allows for the inclusion of macros. The result is your Excel dashboards can be downloaded out of the system at any time with the most up to date data without the fear of any calculation or link breaking. In addition, the data can be posted to other data tables on a scheduled basis allowing users to use services such a Tableau or other reporting services. The report may also be emailed to dedicated users on a scheduled basis.
With the launch of our new custom reporting feature, DemandCaster has expanded its services to offer custom built Excel dashboards and reports from our in-house Excel expert, Jordan Axelrod. Jordan is what many consider an excel guru. He will not only support our clients with their custom reporting needs but he will build a repository of templates that will be available for our clients as well as non-clients to apply at their own company.
We are really excited about this new capability and will be providing a series of blog posts and webinars that will help introduce the new capability with real life examples. Our custom reporting is just another way we are continuing to provide valuable demand and supply planning tools and services to ensure we exceed our client’s expectations. For more information on DemandCaster custom reporting capability please click here.
Introduction to the Excel Templates
Before we get in to the first Excel template, it’s important to note a few key qualities in the Excel templates that truly make them powerful tools.
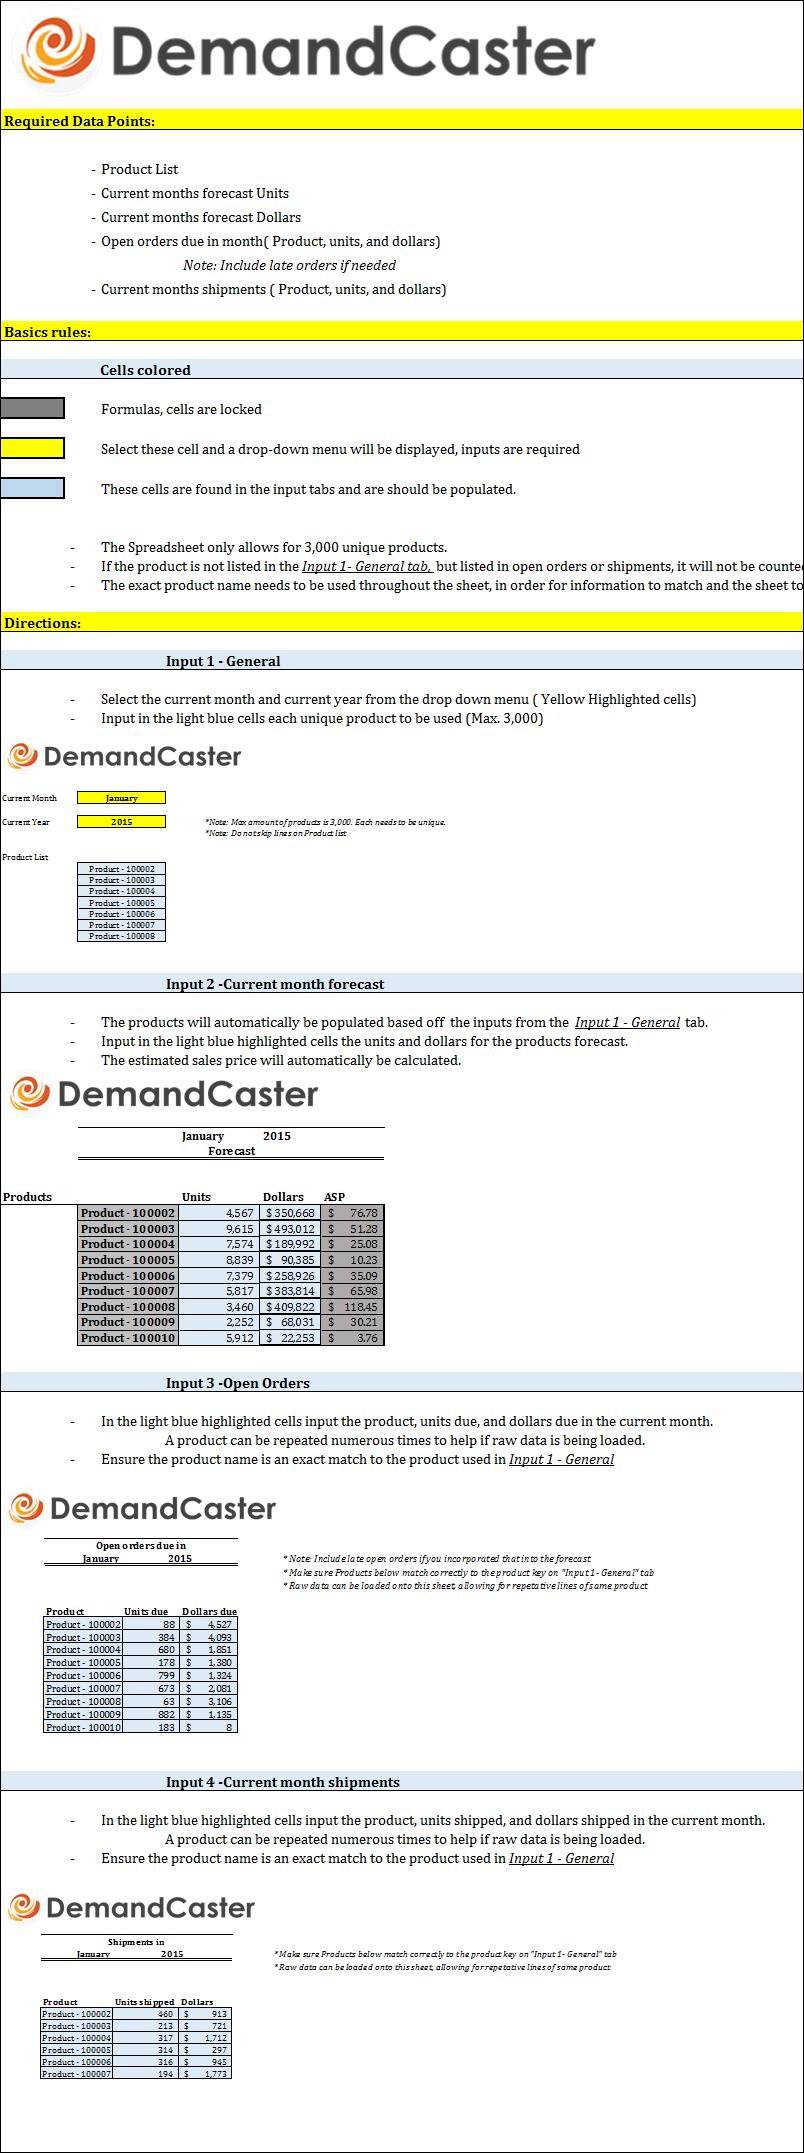
1. One of the most important qualities is the overall ease of use, which directly ties to the core values of DemandCaster, focusing on user-friendly software and resources. Each spreadsheet contains an introduction and directions tab which simply guides you through dropping the data in the designated spot, the image to the right is a clip of the directions tab. You can use the template even without a DemandCaster subscription.
2. With regards to building Excel dashboards and templates, our in-house Excel expert has a very strict policy to build the templates to automatically update with time without making technical adjustments.
-a simple example of this would be the Forecast Consumption Excel template below, which is based off the current month. In the first data input tab is a drop down menu for selecting the month and year, once the user sets the month and year, the entire spreadsheet will update to reflect the user defined time.
The philosophy we use when building our templates is to put in a little extra work in the front end to keep the templates automated and more importantly take away as much possibility of compromising the overall integrity of the template with tedious updates that must occur to keep up with time. This philosophy has become even more important and valuable to the DemandCaster team and our clients as we launched our custom reporting feature (mentioned above), meaning once a fully automated template is built and loaded into the custom reporting feature and the data points have been mapped in the template, no additional maintenance is required. The template will always be updated with the most recent information at the click of a button.
With the above in mind, below is the first of our Excel templates available to DemandCaster users and non-users alike. To access the template, complete the sign up form to receive the download:
Forecast Consumption Template
 This Excel template was designed to help you track your forecast inside the month. The template contains TWO REPORTS; a Product Consumption and an Overall Forecast Consumption report. The purpose of these reports is to keep a close eye on how you are tracking to forecast inside your planning horizon. While there maybe little that can be done concerning inventory, these reports can help companies quickly notice if sales are not coming in as planned, which can quickly alert the executive team to implement some type of last minute promotion to avoid excess inventory.
You see two types of comparisons to forecast in the reports:
1. Total Demand: Total Demand = (Open Orders + Shipments)
– This is where the sales team usually wants to track performance, which is based off the total demand, which is the sales function.
2. Actual’s: Actual’s= (Shipments)
– This is usually where finance is tracking to, as it is looking at the reality of what has actually occurred and is considered recognized revenue.
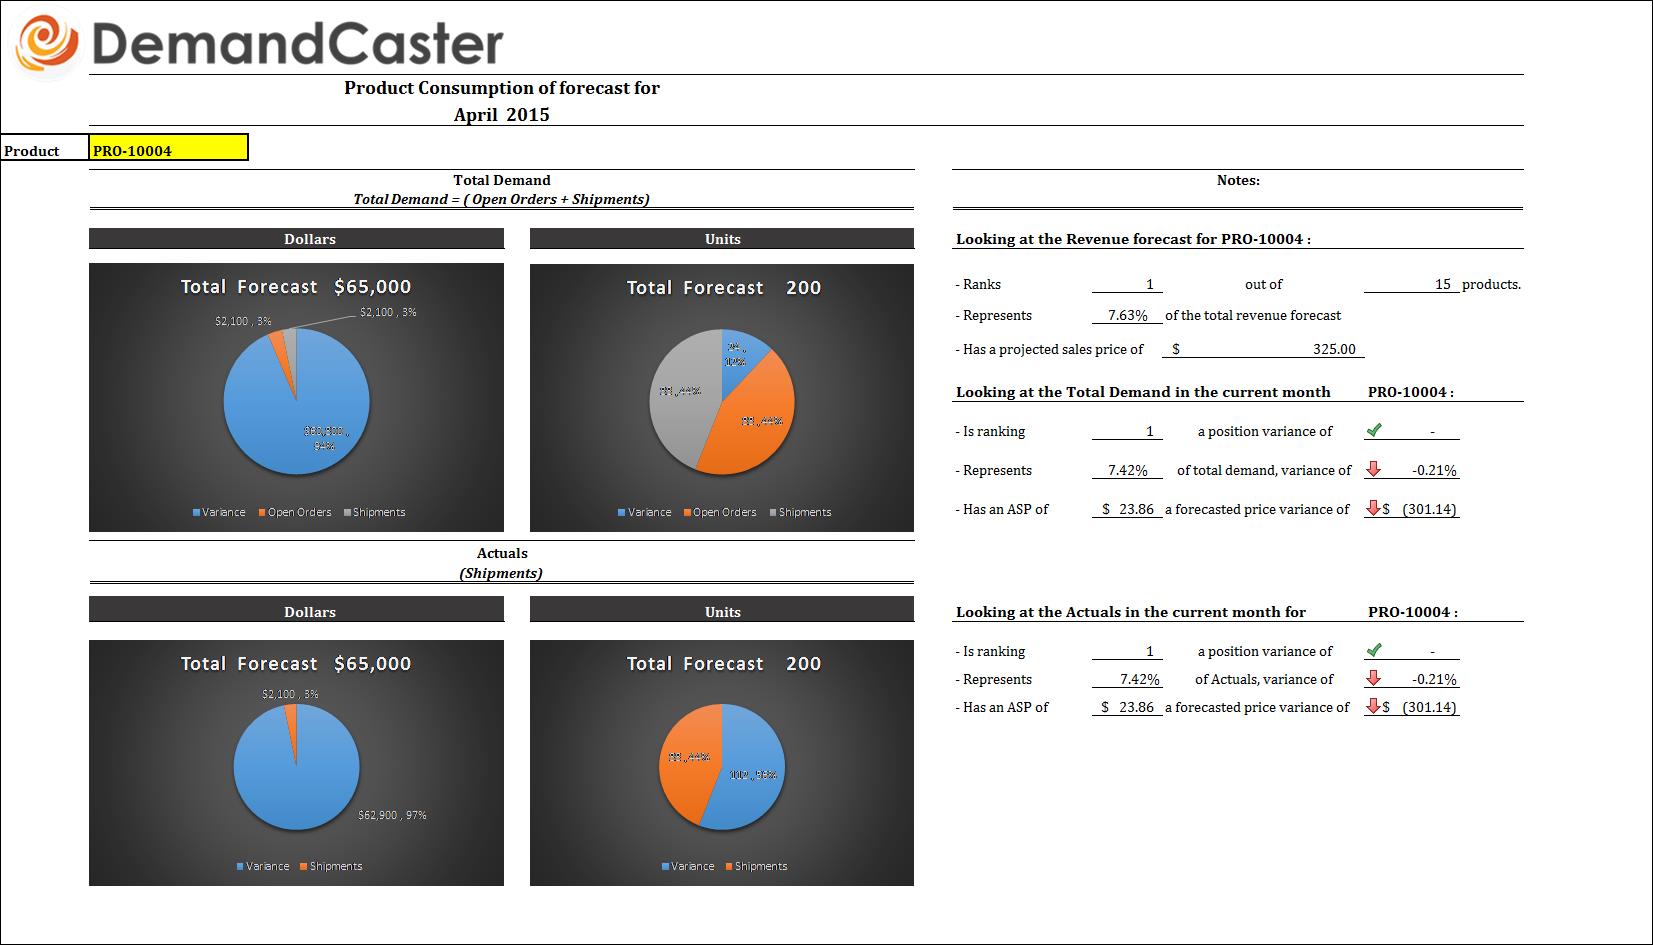
Forecast Consumption Report #1: Product Consumption Report
-The yellow highlighted cell is a drop down menu of every product.
-Once you select a product from the drop down menu, multiple charts and notes will be populated with information regarding the product.
– The charts will give you units and dollars for total demand and units and dollars for actual’s.
– In the note section you will be able to view how the product ranks against the other products as well as how much demand the product represents in total. The projected sales price is also given. A comparison in both Total Demand and Actual’s is done showing the variance of ranking, % of total revenue, and ASP.
Forecast Consumption Report #2: Overall Consumption Report
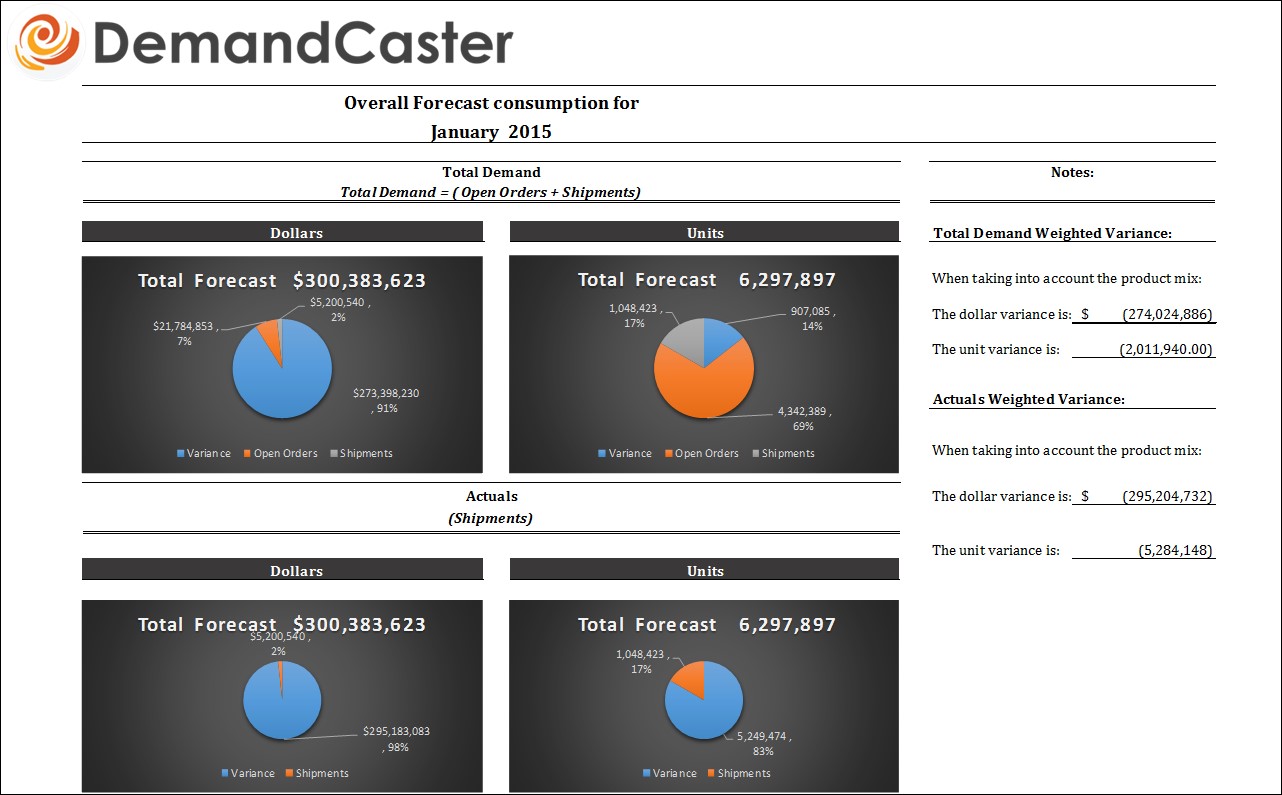
– The charts will give you units and dollars for total demand as well as units and dollars for actual’s.
– In the notes section you will be able to see the Total Demand and Actual’s Weighted Variance, the Weighted Variance is taking into account the product mix and how much from each product is still outstanding
Required data:
- Product List
- Current month’s forecast (Units)
- Current month’s forecast (Dollars)
- Open orders due in month (Product, units, and dollars) Note: Include late orders if needed
- Current month’s shipments (Product, units, and dollars)
The directions can be found in the second tab of the Spreadsheet titled “Directions” to download this Microsoft Excel Template please fill out the sign up form below and the file will be emailed to you.
Final Thoughts
We hope you find this Microsoft Excel template useful. To receive a copy of this and our other 3 S&OP templates, please complete the subscription form at the top right-hand sidebar of this page.
If you have any questions or would like more information on what we have to offer at DemandCaster, please feel free to contact us, we are always happy to hear from our readers.