There is no question that Microsoft Excel is one of the most popular business tools used throughout the world. The power of Excel is extraordinary and while many skilled users are able to make it perform complex data management tricks, they could be costing their company a fortune when used to make business decisions. If you find yourself to be one of these savvy users ask yourself, do you truly know the rules behind the formulas? Are you confident when editing sheets that the integrity of the calculations and data are preserved? Do you spend enough time learning the story behind the numbers or is too much time spent just getting to the numbers?
For the sake of this article I will mostly be referring to the demand and supply planning areas of a business. A common problem in a lot of small businesses that are growing is failure to recognize when the business has reached the size that is better served with a more subject specific software to handle all the heavy lifting. It can be hard for the small to mid-sized businesses that currently run everything off Excel to agree to implement new software. It is easy to rationalize and simply stick with what you know best and continue to push the limits of the workbook.
I know this too well. Early in my career I was much more than a skilled Excel user, I was an obsessed “Excel Junkie”. The transition became easy once I accepted a simple business rule for Excel:
Microsoft Excel is best served as a reporting tool and short-term analysis tool.
When I finally accepted this rule, my value to the business increased dramatically. From a business perspective, keeping this rule in mind will not only improve your efficiency but likely your accuracy as well, with the byproduct of course being cost-savings. Depending on the level of business decisions that are being made off large data sets analyzed in Excel, the risk of errors can cost the business tremendously.
I was lucky to start my career off in a start-up LED-lighting manufacturing company, backed by private equity, and showing incredible annual growth in sales (our first year sales were approximately $50M, the next year sales were approximately $130M). Like many start-ups, people wore multiple hats in the company. I was in charge of sales analysis, operations analysis, financial analysis, demand planning, the S&OP process, and unofficially “Chief Excel Junkie” (self-proclaimed title). My life was consumed by data housed in an ERP system. Unfortunately for me, the data was incredibly inaccurate. I quickly became consumed with data manipulation in Excel followed by very large 100MB+ Excel analytical files. 95% of my time was spent on just data manipulation and building or rebuilding analytical tools in excel that usually ended with getting too big and crashing. I was always frustrated and even more importantly only 5% of my time was actually focused on the job at hand to interpret and understand what the numbers from the analysis were telling me.
One of the board members who was also like a mentor to me changed my perspective on managing my role when he noticed how obsessed I had become with Excel. He sat me down and said:
"You either own the data or you let the data own you."
At first I thought, do I need a new mentor, does he think he’s Mr. Miyagi or something? Over the next few days he started mapping out for me what a smooth running, efficient, process driven company looked like. My eyes were finally open, it was as if I had just been converted to a new religion. My loyalty to Excel had finally been broken and I was enlightened with a few critical ideas:
- I had been ignoring the root issue and only perpetuating the problem by using Excel. We needed to clean the data housed in the ERP system and then implement appropriate business rules to ensure the data going forward would be accurate. Managing the cleansing outside of the system only exasperated the problem.
- Because were cleaning the data issues outside of the ERP, the “accurate” numbers were living in numerous spreadsheets and never matched other functional areas numbers. In essence, each functional area was singing from a different sheet of music.
- By cleaning the source data, I could begin using the ERP system reports. Most of the reports were standard in the system and could be updated in real-time by a click of a button. If the report did not exist in the system it could be built within the system. This allowed for a drastic change in efficiency, consistent numbers throughout the company, and allowed the executive team to identify and react quickly to changes in the business.
- No matter how big your Excel ego is (I took the crown for this), when dealing with large data sets and complex calculations you may build it right the first time, but the second you start tweaking it or let other people play around with it you’re doomed. Here is a great article to read by Jeremy Olshan: 88% of spreadsheets have errors that illustrates the problem.
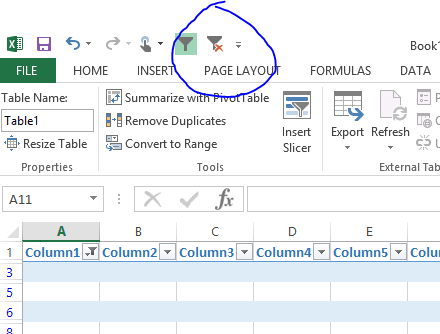
- The most common problem I notice in Excel is people that are sending anything in a table structure leaving filters set or hidden rows. Its incredible how many mistakes were a result of this very simple oversight. My best advice if you work in Excel is to add the “Clear Filters” command to the quick access toolbar. This will allow you to quickly see if a filter is set if it shows a red X as opposed to gray.
- In regards to sales forecasts, spending all your time organizing the information in Excel will leave you with practically no time to spend on the important task of forecast validation. The power of most demand planning tools is incredible, with the functionality to quickly get you the type of information needed to help drive reliable and quantifiable planning decisions that can be continuously improved.
My greatest triumph over Excel was by far in the area of demand planning. I remember a painful chapter in my early career trying to run a forecast in Excel that would blow out to the SKU’s and then the more painful process of forecast validation. Even focusing simply on A-items via ABC analysis took up a huge chunk of time when formatting templates and trying to view the data at multiple levels. DemandCaster , the software my company finally selected after a long road of implementing other software allowed me to view the forecast quickly and from numerous aggregations to pinpoint problem areas. It also easily exported to Excel which allowed me to fine tune an executive reporting template tailored to my executive teams preference and more importantly kept the heaving lifting in the software while simply using Excel to supplement reporting. At the end of the day time, money, and accuracy were all saved from the software implementation.
Breaking the Excel habit is no easy feat. It can be difficult getting people to step out of their comfort zone and open up to change. It takes time to get the savvy Excel user to adopt a subject specific software, but they will quickly start noticing positive changes to the business and to their job. I came to understand this so well that I ended up joining to work on DemandCaster full time!
Making the decision to implement subject specific software to supplement the reporting power of Excel is the important first step but it doesn’t end there. Selecting the best software for your business is the next big step. I will be sharing my experience trying to implement the best demand and supply planning software in a three part series titled “
”